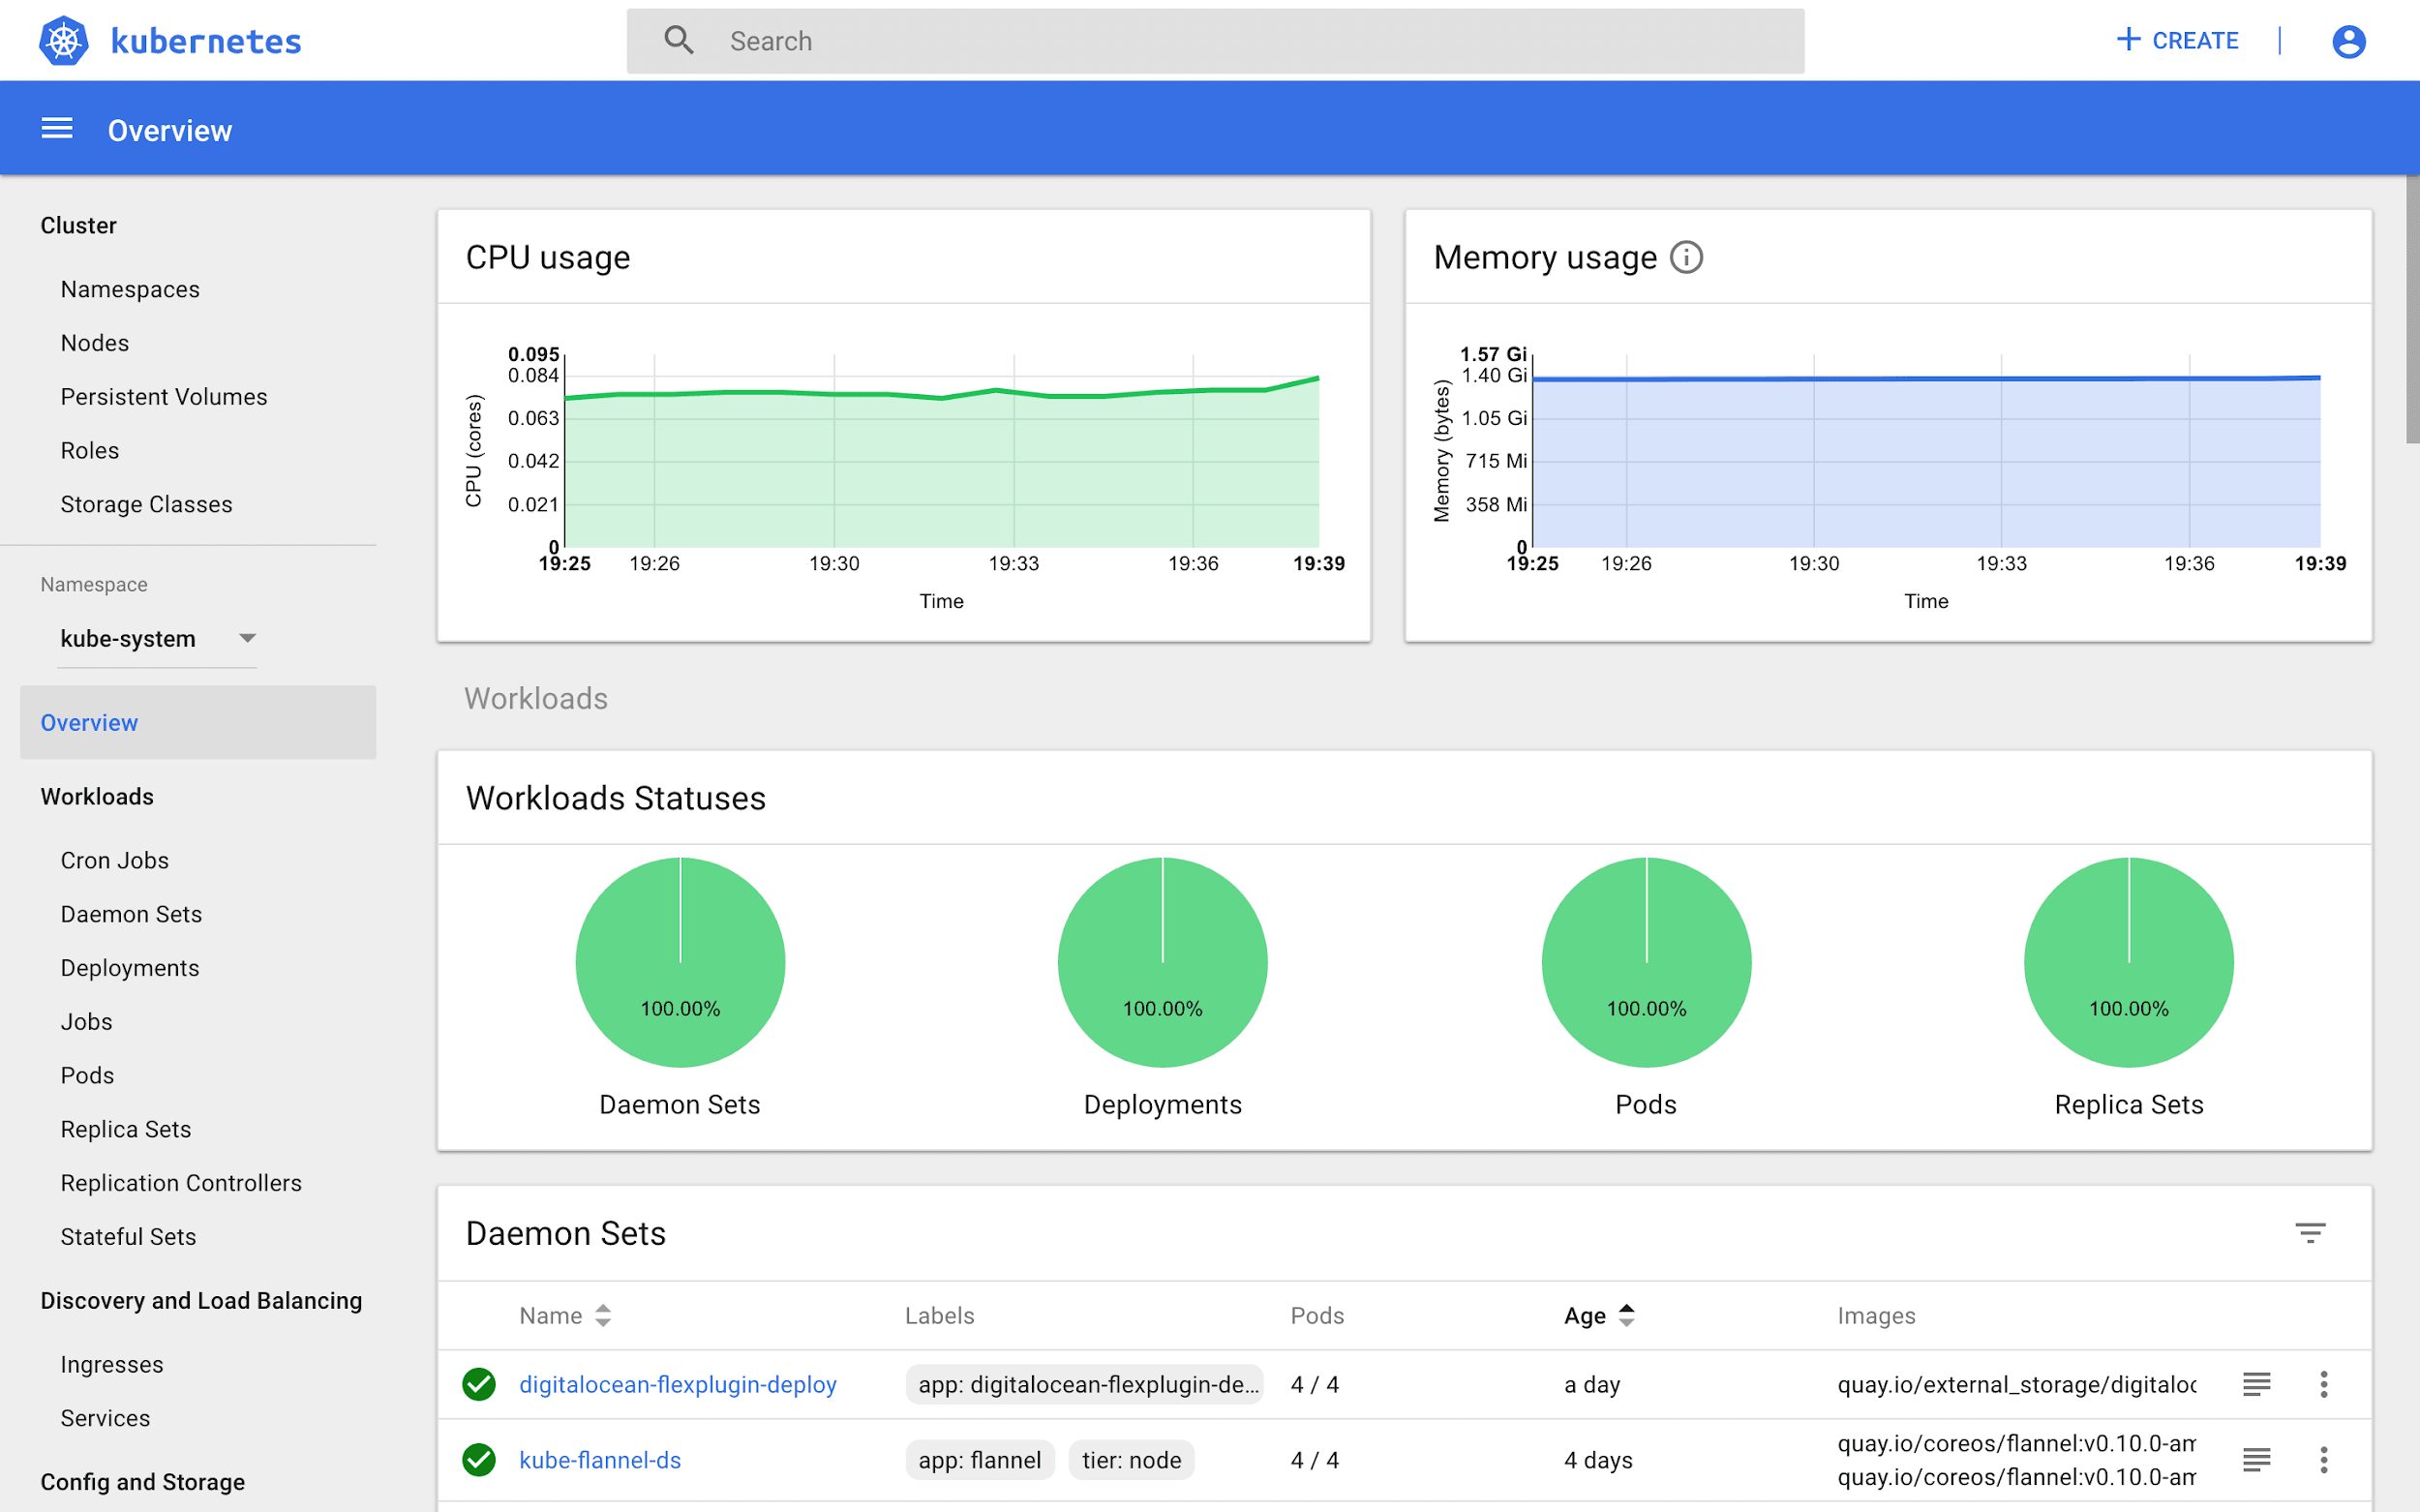
The Kubernetes Dashboard is the UI-based web interface for Kubernetes, which presents a comprehensive overview of individual resources running and the Kubernetes cluster. It helps professionals to overview and administrate the monitoring Kubernetes cluster aspects.
The diverse functionality of the Dashboard of Kubernetes include:-
- The Kubernetes cluster overview
- It allows effective deployment of the application over the Kubernetes cluster.
- Overview of how the application is running
- Troubleshooting the applications
- The Kubernetes resources can be edited, deleted, or modified
- It provides the status of the application running over the Kubernetes cluster. Resources usage of the Kubernetes
How to Install the Kubernetes Dashboard Using Kubectl?
We are assuming that the Kubernetes cluster is already up and running. Additionally, you’ve installed Kubectl.
Below is the code for installing the Kubernetes Dashboard; you need to locally file the YAML code with the use of the Kubectl create function.
“kubectl create -f kubectl create -f Kubernetes-dashboard.yaml”
With this command function, you can service and deploy the Kubernetes Dashboard.
How to Access the Kubernetes Dashboard Using Kubectl?
Once you’ve created the Kubernetes Dashboard, the next step is accessing it. To accomplish this, you are required to spin the server between the Kubernetes API server and the local machine.
To access the Dashboard, browse to the following URL:-
http://localhost:8001/api/v1/namespaces/kube-system/services/https:kubernetes-dashboard:/proxy/
Open this URL, and then authenticate your account to access your Kubernetes Dashboard.
How to Authenticate the Kubernetes Dashboard?
There are generally used ways to authenticate your Kubernetes Dashboard; you can either opt for the kubeconfig method or via the token. Most professionals trust the token authentication method.
Firstly, you are required to create a new service account and then bind this account to an administrative role to access all the resources of Kubernetes.
Use the Kubernetes code to create the service account: kubectl create service account dashboard-admin-sa
Next is to bind the service account to the administrative role, for that use kubectl create cluster role binding dashboard-admin-sa
–clusterrole=cluster-admin –service account=default:dashboard-admin-sa
The Kubernetes Dashboard

The Dashboard for Kubernetes monitoring has four critical components are:-
- Config and Storage
- Cluster
- Workload
- Discovery & Load Balancing.
Let’s have a quick overview of each section:-
Config and Storage
The critical segment of the Dashboard Kubernetes provides information about Secrets, Config Maps, and Persistent Volume Claims.
The persistent volume claims present all the data you need regarding the PVCs in the Kubernetes cluster.
Cluster
The cluster view of the Kubernetes Dashboard has the following crucial segments:-
Namespaces: Overview of all namespaces in the cluster.
Nodes: Node listing overview of the Kubernetes Nodes in the cluster.
Workloads View
The overview of all the applications running in the cluster. These include Pods, Deployment, ReplicaSets along with Kubernetes controllers.
The subsection Pods present a full-suite view of the Pods running in the Kubernetes cluster. The dedicated page outlines all the necessary information for every individual pod, including the Namespace and Node as well as the Status and Number of restarts.
Discovery and Load Balancing
The next section is discovery and load balancing; it has two Kubernetes objects: Ingresses and Services. The services section highlights essential information of each service in consideration, including the Cluster IP, labels attached, etc.
Conclusion
In this article, we took a look at the fundamentals of the Kubernetes Dashboard. We began with the functionality of the Dashboard; then, we covered the installation mechanism, deployment, and authentication.
There are several tools for comprehensive Kubernetes monitoring, such as Heapster, which helps in the monitor and performance analysis of the Kubernetes cluster.


